
Appearance
The Main Screen
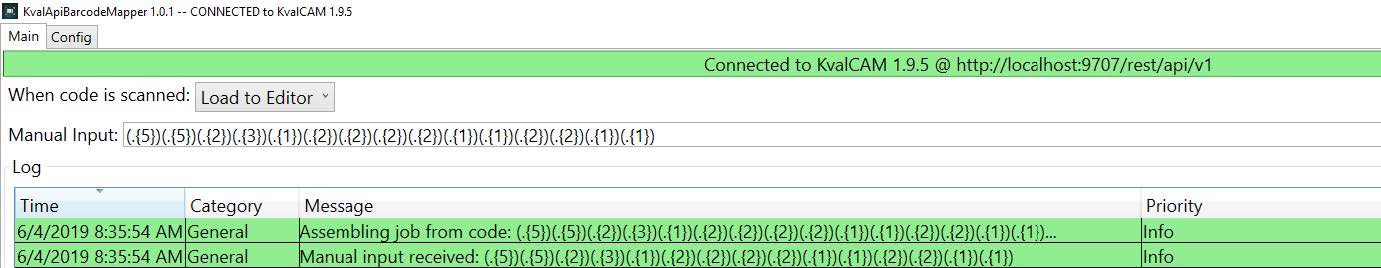
The Main Screen acts as the Operator’s Interface. The operator can choose the location where the scanned data is placed in the KvalCAM host. Feedback of the scanning process is displayed in a viewing window. See below for descriptions of the Main Screen. The host and KvalCAM version is visible in the window's title bar (top left).
Connection Status
The Link bar at the top of the window (just under the Main/Config tabs) displays the connection status of the Barcode Application. The connection status is color coded. The connection address path is also displayed. While connected the bar will be green, and red if disconnected.
TIP
If disconnected, verify that the KvalCAM host is running. If running the application locally, verify connections. If running by way of intranet, verify that the system is up and running.
Door Job Placement
Using the drop down menu you can choose where to insert the door job into the KvalCAM host.
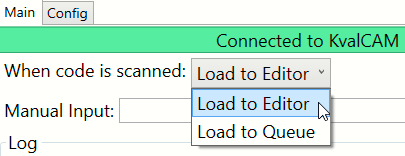
| Option | Description | Example |
|---|---|---|
| Load to Queue | Load the door job directly in the KvalCAM queue to process the door. | 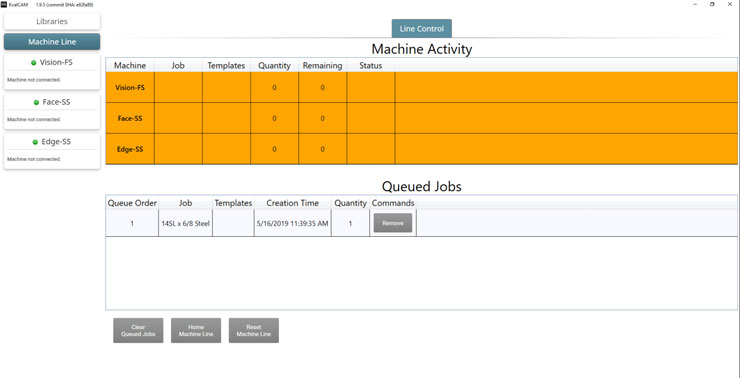 |
| Load to Editor | Load the door job into the KvalCAM editor. At this point the door parameters can be changed if needed. | 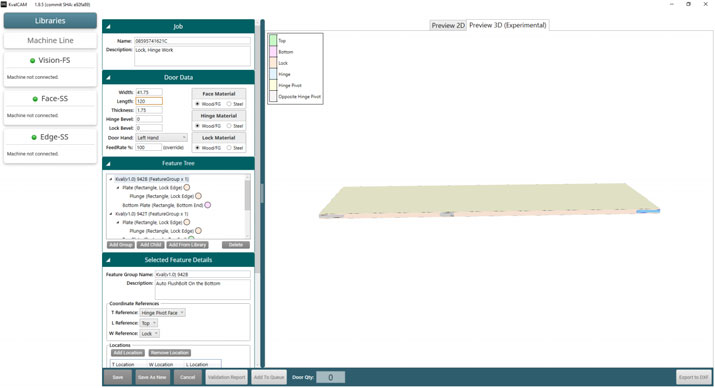 |
TIP
For more information about KvalCAM Door Editor and Door Queue, see your Operation Manual.
Manual Input
Data may be entered manually to create a door job. This mimics the barcode scanning process. Commonly used to check out a new door job, check code, or troubleshooting. For example, a code was entered in the figure below to start a door job.
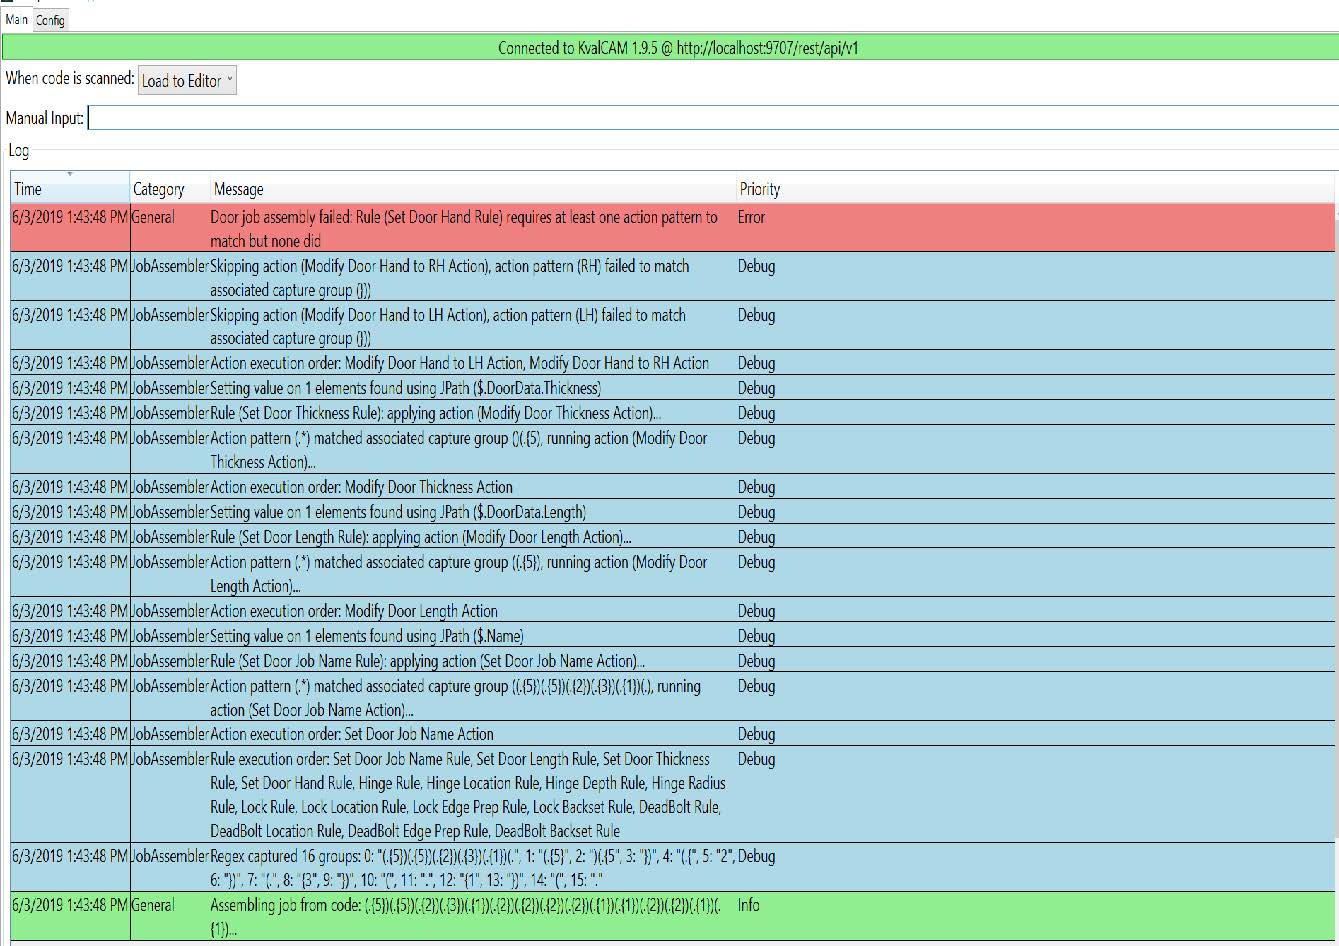
Logging Window
This window displays all logs and is essential in following the progress of the door job. Logs are used to see how the scanned/inputted jobs are processed.
Real time information, errors, and verifications of the system are displayed. The log entires are color coded and are identified by type in the displayed table.
| Title | Description |
|---|---|
| Time | Displays the date and time to the second of the event |
| Category | General: Classification of all logs JobAssembler: Displayed in the unlock mode |
| Message | Information about the event |
| Priority | The status of the level of the event, e.g.: Info: Informational messages, blue background. Error: A problem was encountered, red background. Debug: Trace program sequence when unlock mode is enabled, blue background. |
TIP
Select the desired tile to sort the events by Time, Category, Message, or Priority.